
Authors: Jennifer Moon, PhD. and Arjun Makhijani, PhD.
In conversations about energy affordability, the unique affordability challenges that rural communities face can be overlooked. Rural communities have lower median household income levels that make it harder to pay bills; are geographically isolated—creating challenges in energy delivery and access to assistance programs; and have higher rates of poor health that increase vulnerability to energy insecurity. Policies intended to reduce urban energy cost burdens do not always apply to or remedy conditions in rural areas. Rural households are more likely to live in manufactured homes (also known as “mobile homes”)—which are often very inefficient. Rural areas face energy infrastructure challenges that, combined with depopulation, result in costs borne by fewer residents, limitations in the ability of rural utilities, which are mainly cooperatives, to transition to clean energy, and barriers that limit access to available utility assistance programs.
At a time of both volatility and an overall upward trend in oil and gas prices, the heavy reliance on fossil fuels promises to worsen energy affordability challenges in rural areas. A comprehensive public policy approach that addresses rural energy cost burdens can reduce the strain on household budgets and improve the health and well-being of rural communities.
Rural Energy Cost Burdens
Average energy cost burdens are considerably higher in rural areas – 4.4 percent of gross income as compared to 3.3 percent in metropolitan areas. While both of these averages are well within the six percent level that is considered “affordable,” many rural households and communities struggle with energy cost burdens that far exceed the average.1
There are three primary factors underlying household energy cost burdens, all of which contribute to unaffordable energy in rural areas:2
- Household income
- Energy prices
- Household energy demand
Energy Prices
Fuel Type
About 85 percent of all homes in the U.S. use natural gas or electricity as their main heating energy source. About eight percent use fuel oil or propane,3 primarily in rural areas, as their main heating source. Propane is a common fuel in rural areas of the South, Midwest, and West, while fuel oil (or kerosene) is common in both rural and urban areas of the Northeast.4
Figure 1 shows recent national average prices for residential supply of these fuels. They were over 50 percent higher than the cost of residential natural gas in 2025. Since the prices of refined petroleum products are very sensitive to crude oil prices, fuel oil prices can also be very volatile. This is clear from the jump in fuel oil prices, seen in Figure 1, shortly after the United States and Israel initiated a war on Iran on February 28, 2026; by March 9, 2026, fuel oil prices were more than double the residential natural gas price in 2025. This price increase corresponded to a sharp rise in global and U.S. crude oil prices after the start of the war, despite the fact that the United States is a net exporter of petroleum.

Figure 1: Recent national average fuel oil and propane prices. The 2024 and 2025 values are annual averages. The February 23, 2026 and March 9, 2026 values are weekly averages. Data source: Energy Information Administration. Data in dollars per gallon converted to dollars per million Btu5
Electricity is also a common heating fuel all over the country, including in rural areas. It is the most expensive source based on cost per million Btu of delivered energy. However, comparisons of actual space heating costs are not straightforward because electricity, when used in heat pumps—as opposed to electric resistance (i.e., baseboard) heating—can deliver more than one unit of space heating per unit of electricity consumed. Heat pump space heating output comes partly from extracting heat from the environment—hence the term “heat pump.” The ratio of space heat delivered into the home to electricity consumed is called the “coefficient of performance” (COP). In effect, electric heating systems can achieve efficiencies exceeding 100 percent when heat pumps are used. Comparatively, it is about 100 percent for resistance heating (COP = 1).
Figure 2 compares the cost of one million Btu of heat deposited into the same home with five space heating choices: fuel oil, propane, natural gas, electric resistance heat, and a heat pump with a COP of 3 at the average 2025 United States residential prices of these energy sources.

Figure 2: Cost of delivered space heat to the same structure at the average 2025 residential energy prices. Assumed efficiencies: fossil fuel
furnaces: 90 percent; electric resistance: 100 percent; heat pump: COP = 3.
Household Energy Demand
Overall household energy demand is determined by active and passive factors: usage by household members (e.g., increasing use due to extreme temperatures) and the energy efficiency of the building envelope. Both factors tend to result in higher energy demand in rural areas. Inland rural areas often experience greater extremes in summer and winter temperatures,6 necessitating more energy for heating and cooling. Rural households are also more likely to live in energy-inefficient residences. Rural residential structures are largely detached single-family structures7 or manufactured homes.
About 8 million of the nearly 144 million residential units in the United States are manufactured homes.8 Rural residents are estimated to be three times more likely to live in a manufactured home compared to urban residents. Not only are manufactured homes typically less energy efficient, but the widespread use of electric resistance heating in them contributes to high energy cost burdens. Figure 3 shows the distribution of heating systems used in manufactured homes in 2020, as estimated by the U.S. Energy Information Administration.

Figure 3: Distribution of heating systems in manufactured homes compared to all US homes. Data source: U.S. Energy Information Administration9
The combined impact of housing types and heating fuels is seen in Figure 4, which is from a detailed 2022 study on energy cost burdens in Colorado. The analysis found that the median energy cost burdens for rural manufactured homes were more than double those of other rural housing types.
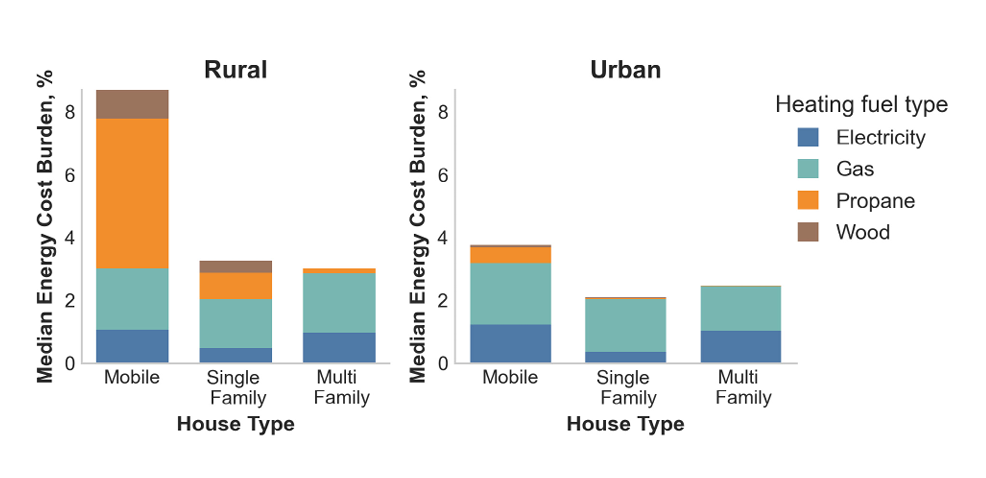
Figure 4: Rural and urban median energy cost burdens in Colorado sorted by three housing types. Source: Lukanov et al. (2022), Figure 20.10
DOWNLOAD THE FULL PAPER FOR OTHER CONSIDERATIONS AND POLICY RECOMMENDATIONS
Footnotes:
1 Ross, L., Drehobl, A., and Stickles B. (2018). The High Cost of Energy in Rural America: Household Energy Burdens and Opportunities for Energy Efficiency. American Council for an Energy Efficient Economy. American Council for an Energy-Efficient Economy.
2 Krieger, E., Daly, L., Makhijani, A., and Moon, J. (2025). Pathways for Action: Affording Our Clean Energy Future. Just Solutions.
3 U.S. Energy Information Administration. (March 2023). Table HC1.1 Fuels used and end uses in U.S. homes, by housing unit type, 2020.
4 U.S. Energy Information Administration. (March 2023). Table HC1.7 Fuels used and end uses in homes in the Northeast and Midwest regions, 2020.
5 U.S. Energy Information Administration. Weekly U.S. Propane Residential Price. Accessed: March 25, 2026; U.S. Energy Information Administration. Weekly U.S. Weekly No. 2 Heating Oil Residential Price. Accessed: March 25, 2026; U.S. Energy Information Administration. U.S. Price of Natural Gas Delivered to Residential Customers. Accessed: March 25, 2026.
6 See, for example, Seavey, J. (2024). Ocean, land, and temperature change NOAA predictions could mean warmer, wetter fall. Island Institute. For a discussion of related urban-rural disparities in health outcomes during extreme heat events, see Ahn, M., Keith, L., and Brown, H. E. (2025). Rural heat health disparities: Evidence from the US national emergency medical services information system (NEMSIS). The Journal of Climate Change and Health, 22, 100432.
7 Taking Stock. Rural Housing: Rural People and Their Homes. Accessed: March 25, 2026
8 U.S. Census Bureau. American Community Survey: 2024 ACS 5-Year Estimates Data Profiles. Accessed: March 25, 2026.
9 U.S. Energy Information Administration (2023a). Table HC6.1 Space heating in U.S. homes, by housing unit type, 2020.
10 Lukanov, B., Makhijani, A., Shetty, K., Kinkhabwala, Y., Smith, A., and Krieger, E. (2022). Pathways to Energy Affordability in Colorado. PSE Healthy Energy and Institute for Energy and Environmental Research.