Using a case study approach in six frontline communities, Just Solutions has developed a Prioritizing Frontline Communities Framework that assesses the “pre-existing” economic, health, and infrastructure conditions that affect the capacity of these communities to cope with, prepare for, and respond to climate change and to participate equitably in the transition to a clean energy economy.
The Perfect Storm of Extraction, Poverty, & Climate Change: A Framework for Assessing Vulnerability, Resilience, Adaptation, and a Just Transition in Frontline Communities, is available on our website for download.
This blog examines the real-world economic conditions in these communities that are significant determinants of climate vulnerability and resilience. For an in-depth overview on the conditions examined here, join our webinar on July 27th, 2023 at 11 AM PST: “Economic Drivers of Climate Vulnerability and Resilience.”
Executive Summary
Through a case study approach, Just Solutions has developed a Prioritizing Frontline Communities Framework for considering and measuring the adaptive capacity and resilience of frontline communities as they confront climate change. It examines the “pre-existing” conditions in six frontline communities that are among the most vulnerable to and affected by climate change and considers the effects of these conditions on the local capacity to cope with, prepare for, and respond to ongoing climate-related challenges. The six communities are Glacier County, Montana; Holmes County, Mississippi; Hidalgo County, Texas; McDowell County, West Virginia; East End, Bridgeport, Connecticut; and East Las Vegas, Nevada. As a counterpoint to these communities, Marin County, California, which lies just north of San Francisco and is one of the wealthiest counties in the country, is highlighted in the data as well.
In regard to Economic Conditions, we find that:
- Histories of exploitation, extraction, predatory practices, and divestment have left these communities with high poverty rates, insufficient income, inadequate economic development opportunities, and exorbitant levels of household debt.
- These conditions put these communities at a disadvantage in their ability to meet their day-to-day needs as they contend with climate change or to respond to a natural disaster, public health emergency, or economic crisis.
- Despite the difficult conditions these communities face, they all have community strengths, demonstrated adaptive capacity and resilience, and an innovative spirit.
- There are policies that could be adopted to improve community conditions, increase adaptive capacity and resilience, and ensure a just transition.
For more information on our methodology and a brief history of each community profiled, please visit our full report.
Economic Conditions
Our study examines three domains: Economic Conditions, Health Conditions, and Infrastructure Conditions in each of these communities. This blog considers the Economic Conditions these communities face and explores policy and community-created solutions. The Economic Conditions indicators examined in each of these communities include:
- Rising poverty and insufficient income
- Rates of home ownership and renters
- High housing and energy cost burdens
- Limited jobs, education, and language access
- Access barriers to transportation
- Too little credit and too much debt
- Access barriers to insurance coverage
In this blog, we highlight a few of the less commonly discussed indicators included above that significantly affect the ability of frontline communities to cope with, prepare for, and respond to climate change and climate-related disasters. These include:
Too Little Credit and Too Much Debt
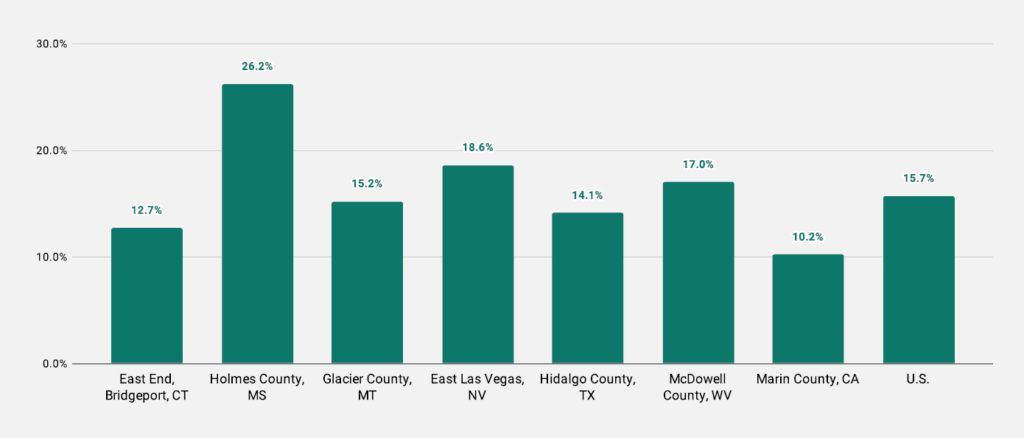
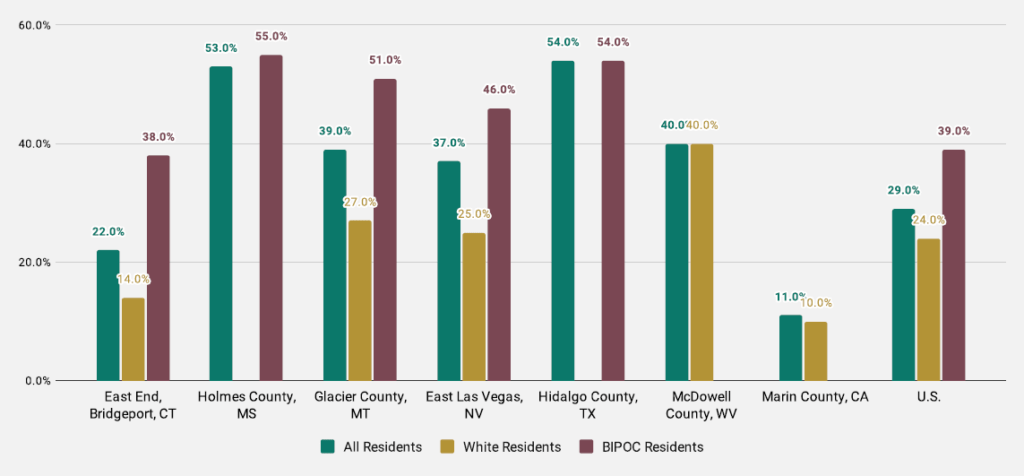
Paradoxically, residents in these communities have both too much debt and too little credit. Many households have zero or negative net worth, are unbanked or underbanked, or have debt delinquency issues that pose a challenge to accessing financing and wealth-building opportunities.1 Without access to credit and financial resources, these communities face greater challenges in adopting green technologies (e.g., weatherization, electric vehicles, energy-efficient appliances, rooftop solar). These challenges are exacerbated for renters who are frequently at the mercy of landlords to make many energy-efficiency upgrades and for those living in poor quality housing units.
In most of these communities, the percentage of households with zero or negative net worth exceeds the national average. Debt delinquency is also higher in these communities.2 It should be noted that falling behind on payments leads to a cycle of accumulating debt from interest payments combined with worsening credit scores, which further restricts credit access.
Households with Zero or Negative Net Worth, 2018

Debt Delinquency, 2018

Access to Insurance Coverage
Lack of access to or inadequate insurance poses another challenge to low- and moderate-income (LMI) households. Although anyone with a mortgage will typically be required to have insurance, that is not always the case. Policies may be unavailable due to:
- The location of the home.
- The condition of the home.
- The homeowner’s poor credit history.
All these factors put homeowners in frontline communities at a disadvantage, resulting in less capacity to recover from climate-related disasters. This is especially the case during disasters that cause flooding and storm surges because most homeowners’ insurance policies do not cover flood damage. Nationally, only 1 in 10 homeowners have flood insurance3, and that insurance usually covers direct flooding, not any damage from storm surge and backup.
Renters are much less likely to have insurance compared to homeowners. Less than half of renters nationally have renters’ insurance. According to one study, only about 25% of those renters with incomes less than $30,000 have renters’ insurance.4
Policy and Community-Created Solutions to Economic Needs
The charts above offer a snapshot of economic conditions in the profiled communities. Examining the complete set of economic data contained in the report presents a stark portrait of communities most at risk from climate change.
At the community level, One Voice in Mississippi is taking action to effect change. One Voice leads an Electric Cooperative Leadership Institute with the Delta Electric Power Association. The Institute works with member-owners living in rural communities, including in Holmes County, to become involved in the leadership of local electric coops. Although most of the residents in these areas are Black, representatives on electric cooperative leadership boards have tended to be majority white. The Leadership Institute seeks to educate and organize residents to generate local economic benefits, address high energy bills, and increase energy efficiency. “Our goal is to make sure that we are creating the next generation of organizers that can advocate for policies and changes within their communities and go head-on with the Board of Directors and say these are the issues we are having, and this is what we feel needs to change,” says Catherine Robinson of One Voice.

At the state and national levels, the ability of frontline communities to pay for rising energy costs, equitably participate in the transition to a clean energy economy and respond to and recover from climate-related events all depend on policy change to improve outcomes for the economic indicators we have examined. Examples of policy solutions that would bring about meaningful and measurable economic change include:
- Enacting wage equity, living wage, workforce development, and education and training policies that close the gap between wages and living expenses.
- Expanding and creating tax credit and refund programs for LMI people.
- Implementing policies such as categorical eligibility, automatic enrollment, and self-attestation for eligibility determination to increase utilization of assistance programs.
- Prioritizing economic development investments and clean energy jobs in these communities.The Inflation Reduction Act, for example, includes tax credit provisions that will help companies set up manufacturing in the US for renewable energy products (solar panels to wind turbines). With protections to prevent pollution and to ensure local hiring and job quality, such companies could be located in LMI communities to displace fossil fuel and other toxic industries.
- Implementing moratorium policies to prevent utility shut-offs or collection agency actions.
- Implementing energy bill payment programs like the Percentage of Income Payment Plan (PIPP), which caps eligible participants’ utility payments at a predetermined percentage of household income.
- Adopting building codes that require more energy-efficiency standards.
- Requiring landlords to make energy efficiency upgrades and offer financial incentives and support, including in Housing Authority Contracts with landlords, rental assistance programs, and municipal affordability programs.5
