
Electricity Price Increases Hit Some Regions Harder Than Others—But Methane Gas Has Gone up Nearly Everywhere
By Elena Krieger, PhD. – Across the U.S., households are struggling to afford rising electricity and methane gas bills, but some regions are facing much more dramatic price increases than others. Countrywide, average residential electricity prices rose 27% from 2019-20241—increasing even faster than the cumulative inflation rate of 23% over those five years.2 This rise in electricity prices, has received considerable press attention,3 driven in part by regional stories, such as in California4, where electricity prices—which were already among the highest in the nation—skyrocketed an incredible 66% over five years.5
The missing counterpart to this narrative, however, is the even more dramatic growth in average nationwide residential gas prices, which surged 39% over this period6—even though the market price for gas was actually lower in 2024 than in 2019.7 And unlike electricity, where prices grew slower than inflation in some places, nearly every state saw methane gas prices exceed inflation during the last five years.
The main culprit for price increases isn’t generating electricity or extracting methane gas. Rather, growing prices stem from delivering that energy to homes across the U.S. against the headwinds of extreme weather and wildfires, spiking electricity demand, underinvestment in energy efficiency, and industry mismanagement with insufficient consumer protections. These factors vary by region, leading to disparate price increases, and in many cases this situation stands to worsen in the coming years without policy interventions. However, even in the absence of meaningful federal policy, state actions to protect households, advance clean energy, and reform utility operations can provide meaningful building blocks to achieve energy affordability now and in the years to come.
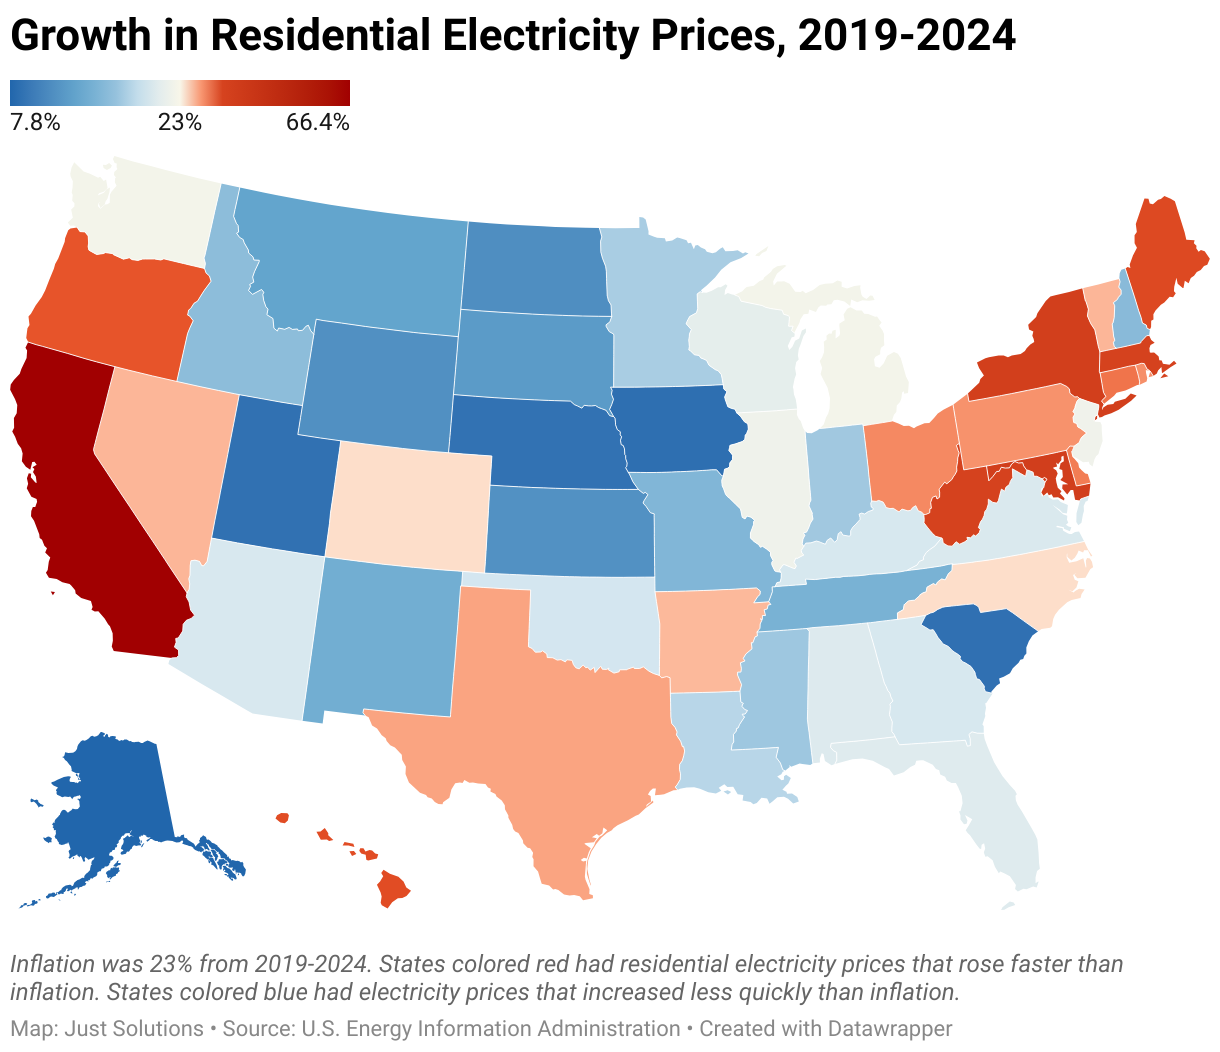
Below, we map the state-by-state differences in electricity and residential gas price growth, showing not only where prices are climbing, but also where prices were already high and have stayed high. In our first map, the growth in electricity prices from 2019-2024 shows a few clear trends: dramatic price increases in the West, the Northeast, and the mid-Atlantic, alongside a few other states like Texas. The core drivers for these increases vary, however. California’s bills are being driven up in large part by billions of dollars in wildfire mitigation costs.8 Texas is struggling to meet its rapidly growing peak electricity demand during summer heatwaves.9 This August, Ohio finally reversed a corruption-riddled 2019 coal- and nuclear-bailout law which has cost ratepayers more than half a billion dollars.10 The grid operator in the mid-Atlantic, PJM, is facing a multi-year backlog in connecting new electricity generation to the grid, which is delaying the interconnection of low-cost renewable energy and battery storage resources and driving up residential bills.11 Across the country, electricity distribution costs—for building and maintaining the systems that actually bring electricity to each home—are rising faster than any other category of electric utility costs.12 And in many states, these and many other contributors are compounding to drive up electricity prices.
More price increases are on the horizon. The average U.S. price for electricity delivered in May 2025 was already 6.5% higher than the same time the previous year. One recent analysis found that utilities have asked for a record $29 billion in rate increases in the first half of 2025.13 Places like Texas and PJM are projecting rapid load growth to support data centers14—but the costs for expanding the grid to support these new loads risk being passed on to other customers unless new consumer protection rules are put in place.15 The One Big Beautiful Bill Act is projected to drive up bills nationwide after repealing tax credits for new clean energy—which will increase the cost of building enough resources to meet rising electricity demand.16 Federal directives to keep coal plants online past their planned retirement dates are costing customers millions of dollars in places like Michigan, where running the JH Campbell coal plant past its slated May retirement ran up a $29 million bill in just 38 days.17
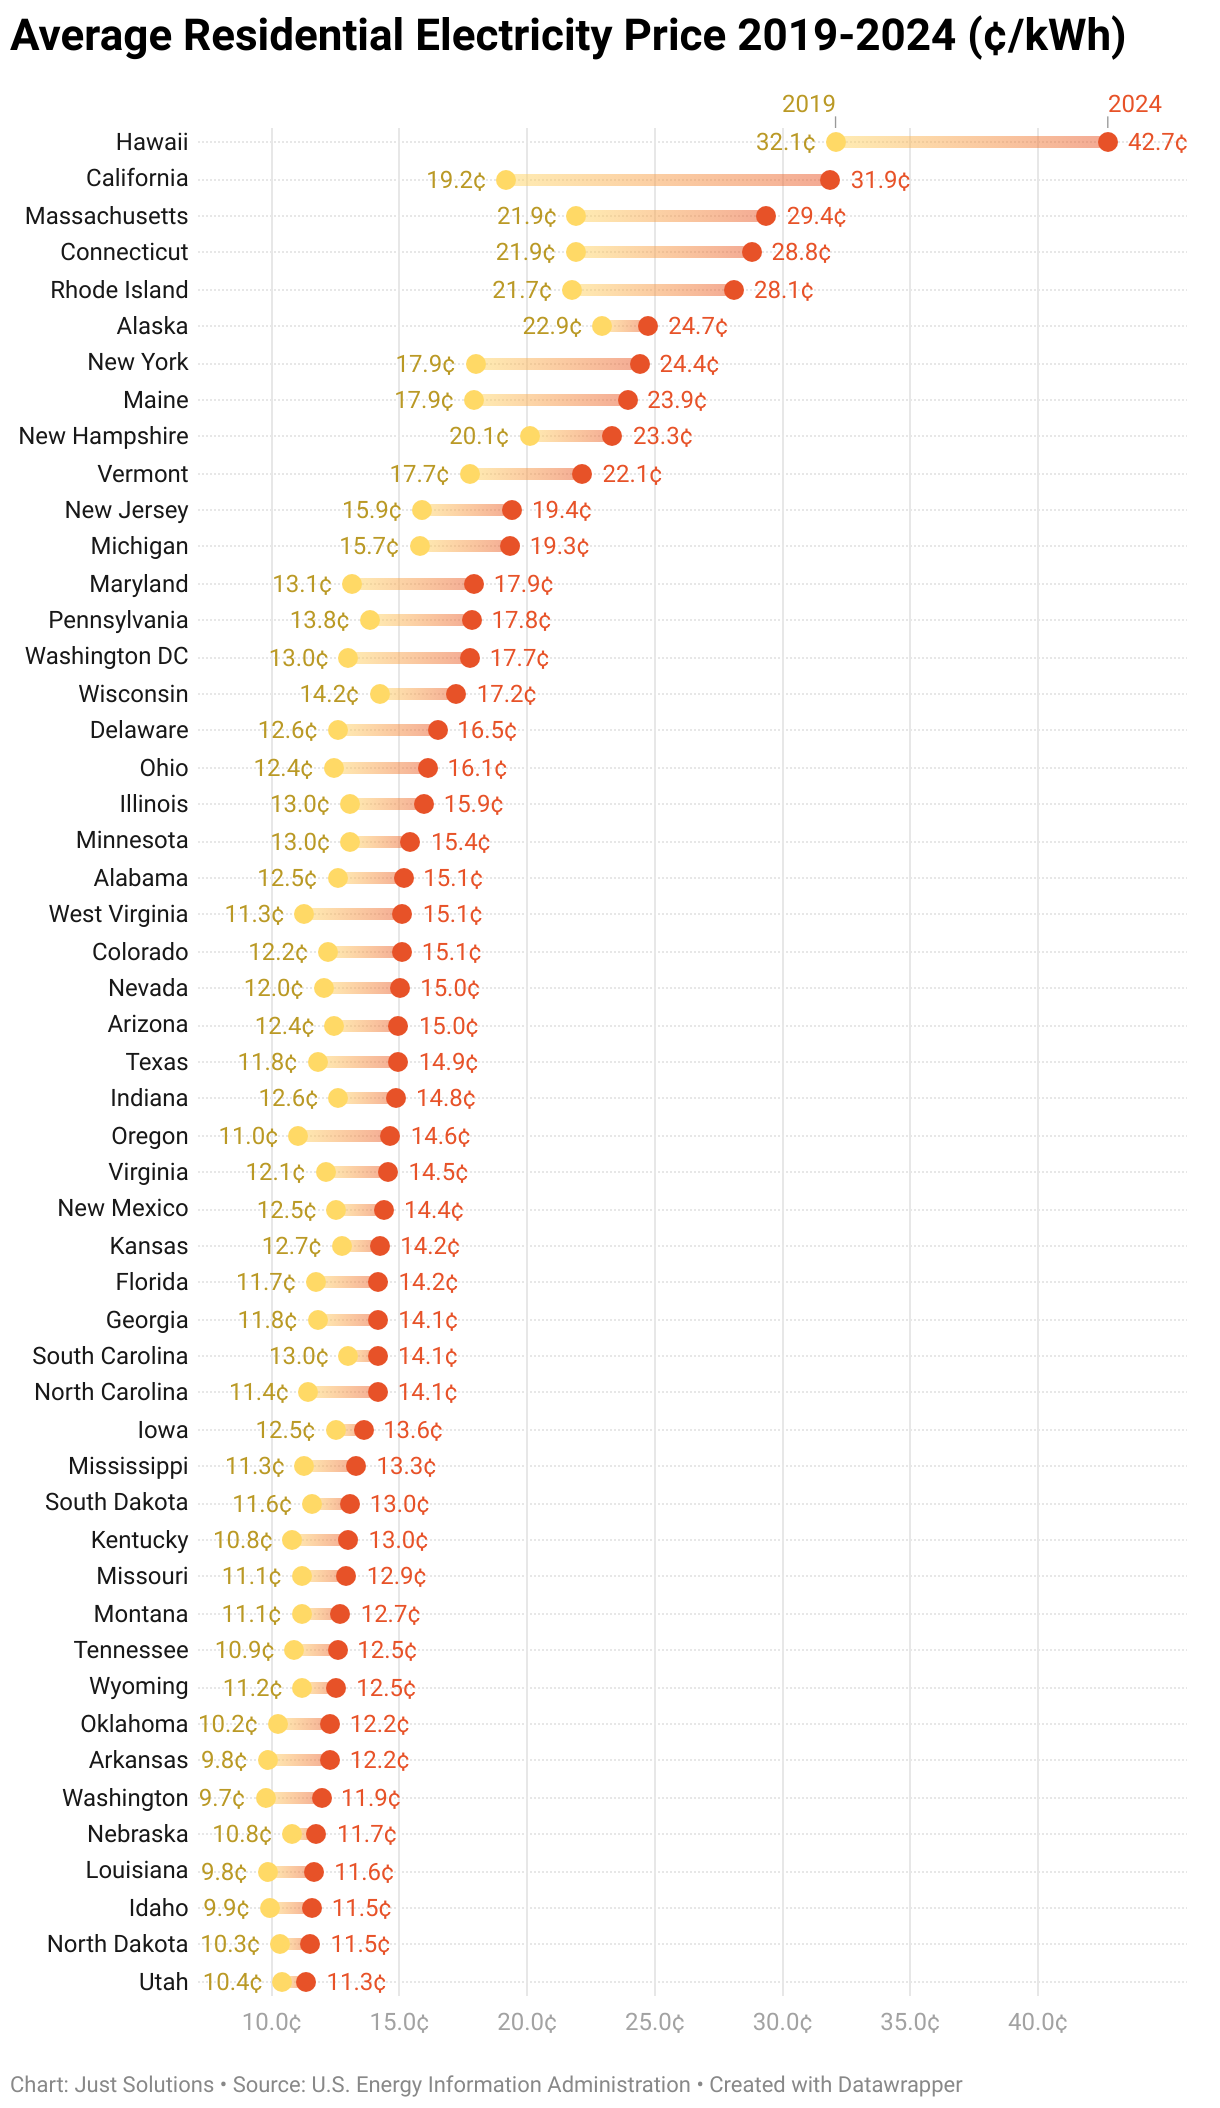
The growth rate of residential electricity prices does not tell the whole story, however. The figure below compares the 2019 and 2024 price for electricity in each state, showing where prices have stayed comparatively low, where they have shifted from low to high, or where they were already high and grew even more. We see that a lot of the highest electricity price increases took place in states that already had high prices, including California, Hawaii, and Massachusetts.
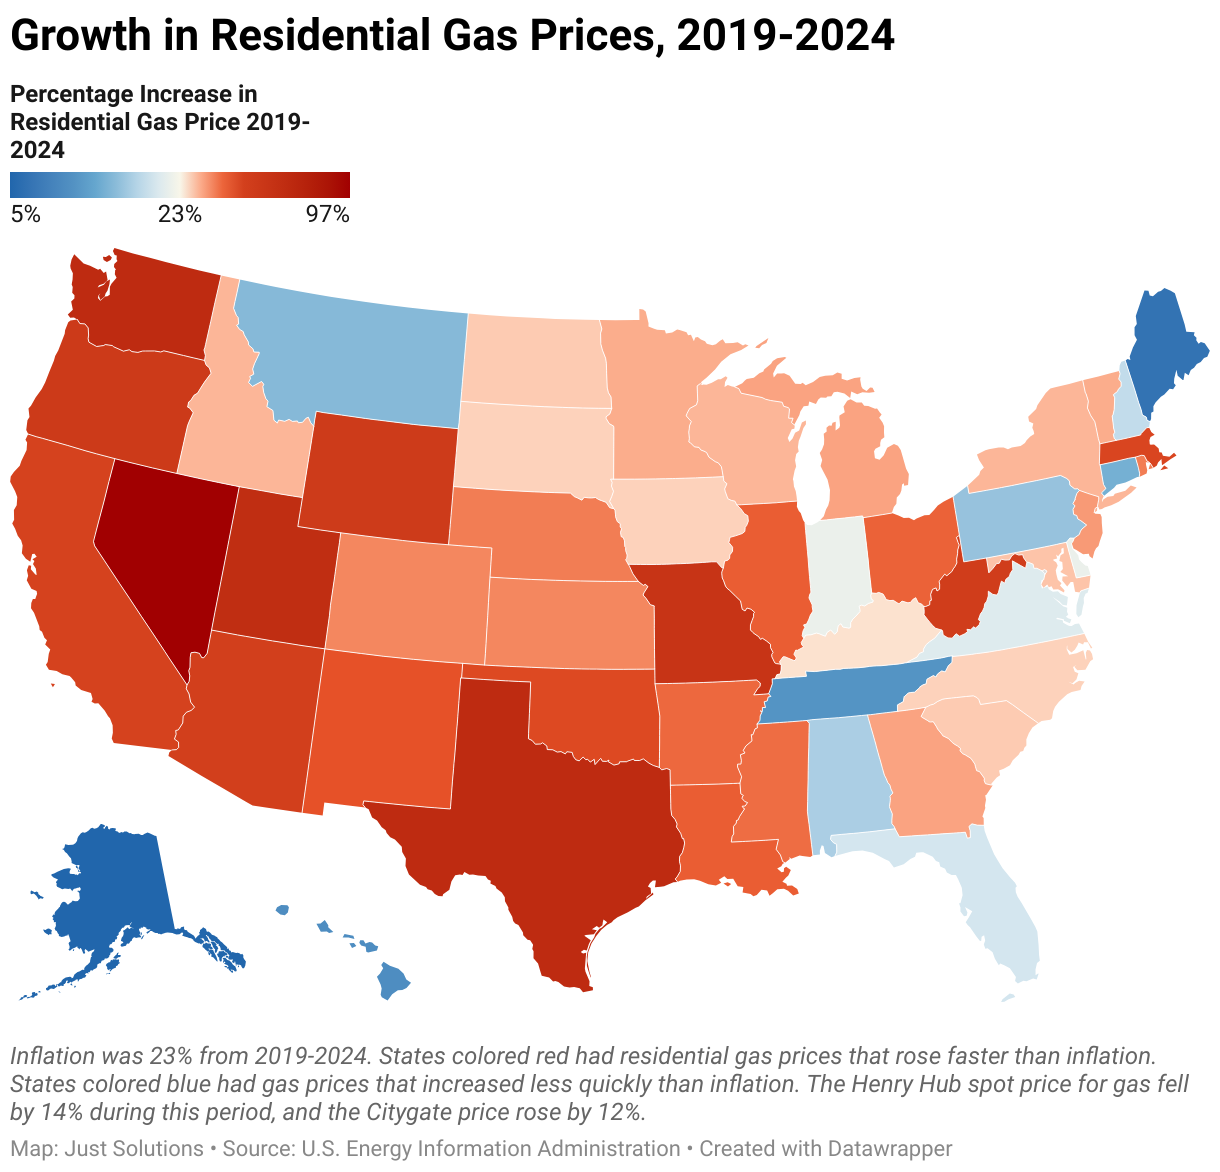
In addition to electricity, the majority of US households (61%) use methane gas, primarily for space and water heating and cooking18—and on average these households are seeing even more rapid price increases than for electricity. The map below shows that three-quarters of U.S. states have seen methane gas prices rise faster than inflation since 2019. In Nevada, prices nearly doubled, while Texas and Washington saw prices go up 70%. Methane gas supply prices are volatile, but do not explain this sustained price growth: although the price of the gas supply spiked in 2022 in response to the war in the Ukraine, it had fallen 14% below 2019 levels by 2024.19 Much like for the electricity system, the charge for gas distribution is a core driver of the increase in gas prices in the states where prices have significantly increased, likely due to investments in gas distribution. Some of the current high prices are due to delayed cost recovery from gas utilities, who are still recouping fuel costs from the 2022-2023 price spike. However, as of 2024, the City Gate price for gas—the point where methane gas distribution utilities purchase the gas—was only 12% higher than 2019, while residential gas prices were 39% higher than 2019, suggesting that much of the gas price increase falls on the distribution side of the ledger. Some states are taking efforts to reduce these costs, such as New York’s recent law to require new customers to pay for their own hookups rather than pass these on to other ratepayers.20
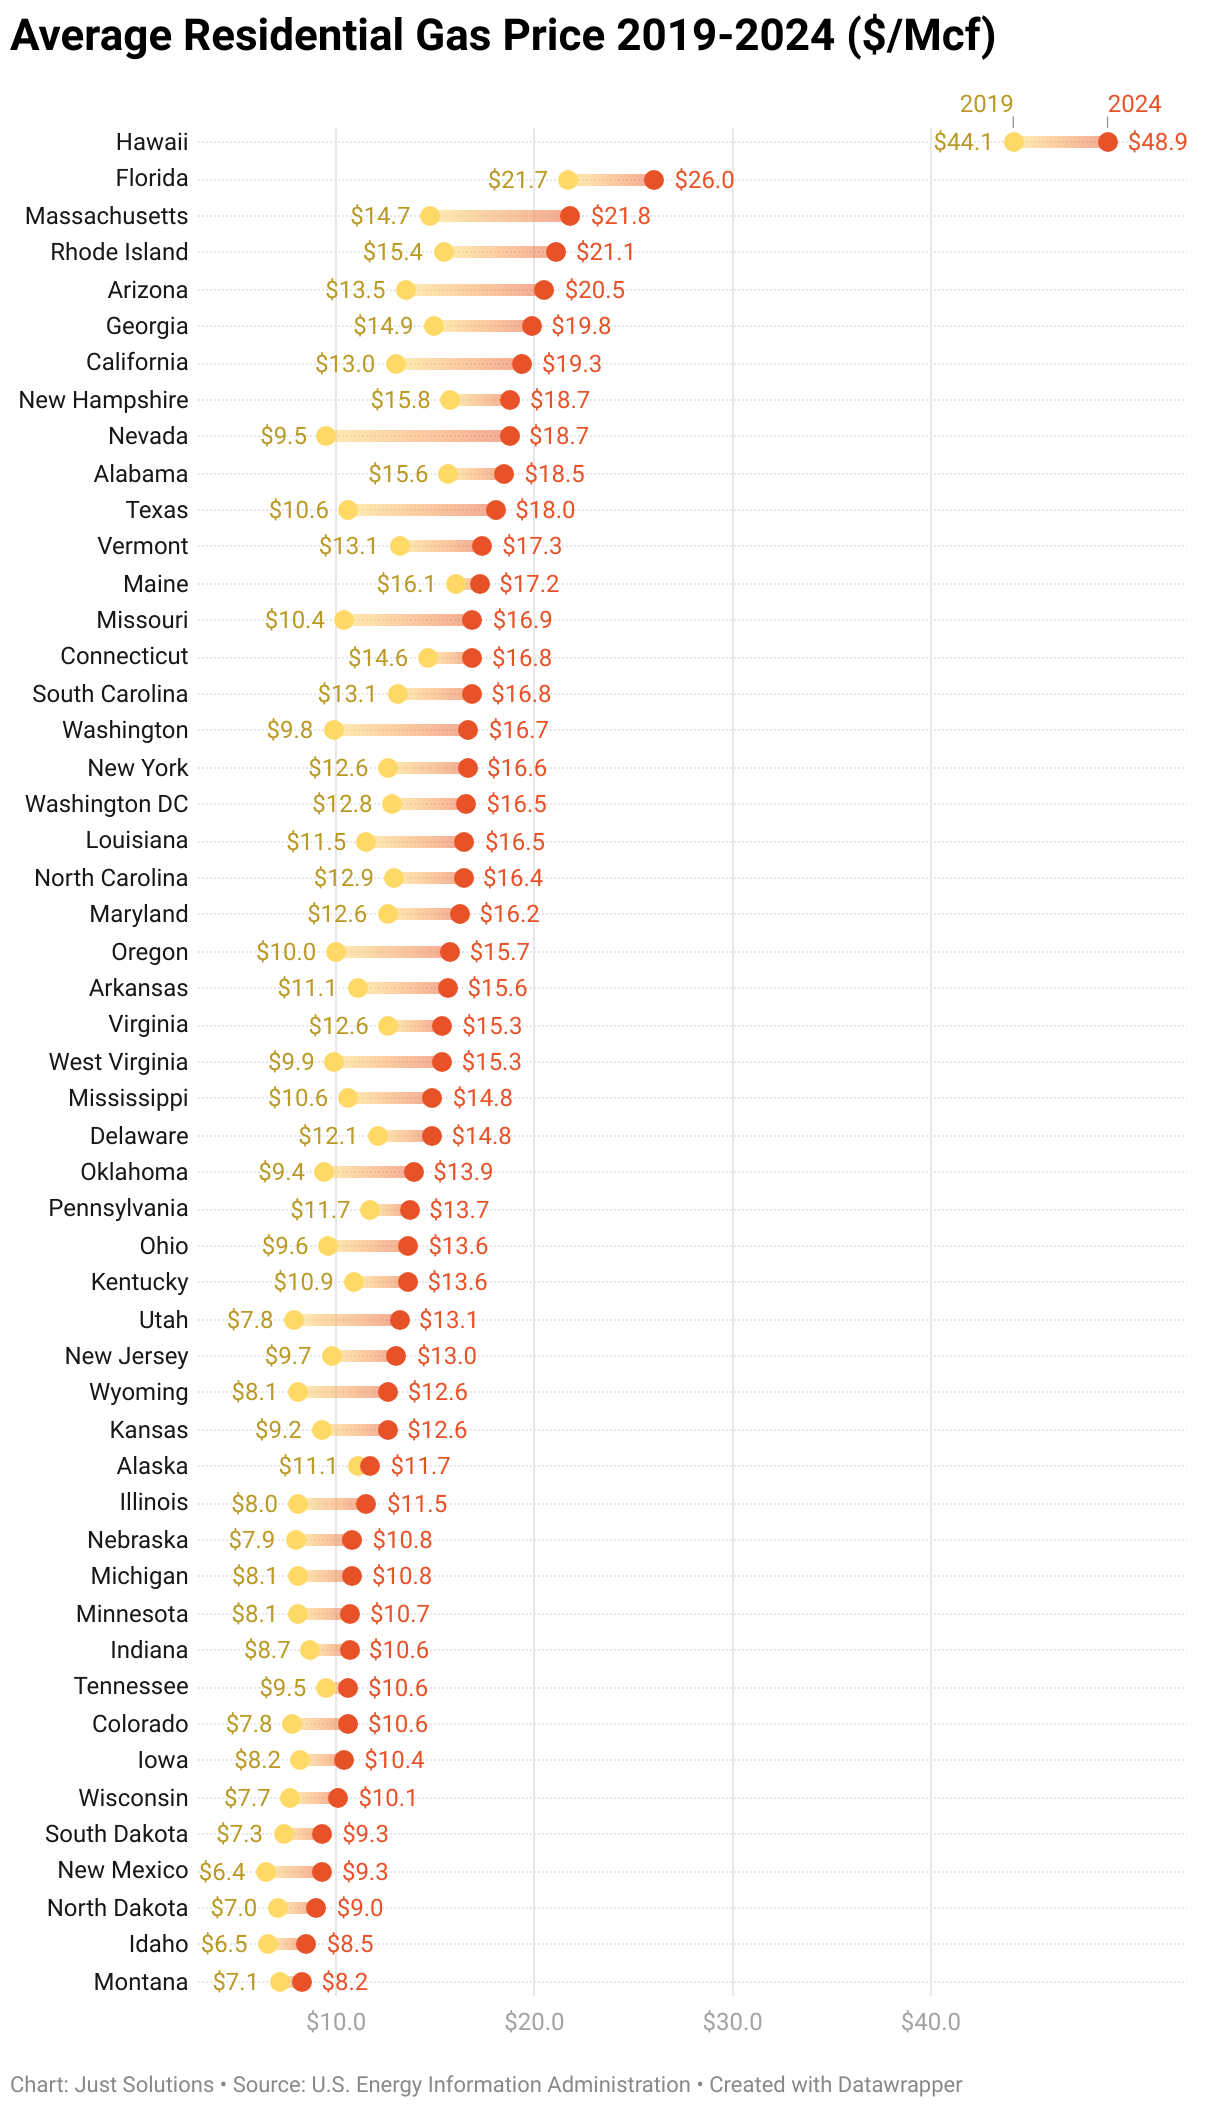
Below, we also chart the 2019 and 2024 residential gas price for each state to get a more nuanced view of how initial gas prices combined with increasing gas rates may be impacting households. Average residential gas prices in Alabama, for example, grew slower than inflation over the last five years—but they were still the tenth most expensive in the U.S. in 2024. Gas prices in Nevada nearly doubled over that same period, launching it from 33rd to 9th most expensive, just above Alabama. Some of the growth in Nevada was ascribed to an increase in the price of the gas supply in 2022 and 2023 and a subsequent rate adjustment to reflect that price increase, but even after gas prices dropped, rates stayed high. The Public Utilities Commission of Nevada found that Southwest Gas over-collected $241 million in the first quarter of 2025,21 and rates have now been adjusted downwards, but are only supposed to reduce bills by about 25%,22 leaving prices much higher than 2019. Looking forward, gas supply prices are notoriously hard to predict, but measures to continue to rein in distribution costs are likely key to curtailing future price increases.
Increasing energy prices alone do not necessarily mean bills have to increase—if energy efficiency measures are deployed quickly enough, for example, households will use less total energy, offsetting price increases. However, the maximum annual electricity efficiency savings in any state in 2023 topped out at 2.56% of retail sales—in Maryland—and only 10 states had efficiency gains greater than 1%.23 No state achieved methane gas efficiency savings over 1%.24 If we take into account the average reduction in demand from efficiency measures,25 we estimate that California, for example, still saw total residential electricity bills grow by 59% in the last five years. Moreover, households that face barriers to adopting energy efficiency measures—including low-income households, renters, and communities of color—will continue to see bills rise with electricity and methane gas prices, even if average bills stay low.
So what do we do? As part of our new energy affordability effort, Affording Our Energy Future: States Lead the Way, we’ll be working on policy solutions—from energy efficiency measures to utility reform—to help states increase access to affordable, clean energy for everyone. Stay tuned!
- U.S. Energy Information Administration. Electricity Data Browser. Accessed: August 20, 2025. ↩︎
- Calculated for June 2019-June 2024. U.S. Bureau of Labor Statistics. CPI Inflation Calculator. Accessed: August 21, 2025. ↩︎
- Irfan, I. (2025). Why your energy bill is suddenly so much more expensive. Grist. ↩︎
- Lazo, A. (2025). Californians pay billions for power companies’ wildfire prevention efforts. Are they cost-effective? CalMatters. ↩︎
- U.S. Energy Information Administration. Electricity Data Browser. Accessed: August 20, 2025. ↩︎
- U.S. Energy Information Administration. Natural Gas: U.S. Price of Natural Gas Delivered to Residential Customers. Accessed: August 10, 2025. ↩︎
- U.S. Energy Information Administration. Natural Gas: Henry Hub Natural Gas Spot Price. Accessed: August 21, 2025. ↩︎
- Lazo, A. (2024). Californians pay billions for power companies’ wildfire prevention efforts. Are they cost-effective? CalMatters. ↩︎
- ERCOT. Yearly Peak Demand. Accessed: August 20, 2025. ↩︎
- Kowalski, Kathiann. (2025). Ohio Utility Watch: ‘Power corrupts’ and regulatory cases continue. Canary Media. ↩︎
- Chavin, S., Knight, P., Shenstone-Harris, S., Zeng, A., Fuzaylov, A. and Hittinger, J. (2025). Tackling the PJM Electricity Cost Crisis. Synapse Energy Economics Inc. for Evergreen Collaborative. ↩︎
- Forrester, S., Satchwell, A., Barbose, G., Cappers, E., Miller, C., and Alberg, A. (2024). Retail Electricity Price and Cost Trends: 2024 Update. Lawrence Berkeley National Laboratory. ↩︎
- Powerlines. (2025). Utility Bills are Rising: Q2 2025 Update. ↩︎
- Wilson, J.D., Zimmerman Z. and Gramlich, R. (2024). Strategic Industries Surging: Driving US Power Demand. Grid Strategies. ↩︎
- Peskoe, A., and Martin, E. (2025). Extracting Profits from the Public: How Utility Ratepayers Are Paying for Big Tech’s Power. Harvard Electricity Law Initiative. ↩︎
- Energy Innovation. (2025). Updated: Economic Impacts Of U.S. “One Big Beautiful Bill Act” Energy Provisions. ↩︎
- Howland, E. (2025). DOE extends order to delay retiring Consumers’ Michigan coal plant. Utility Dive. ↩︎
- Diamond, K., and Sanders, M. (2023). The majority of U.S. households used natural gas in 2020. Today in Energy, U.S. Energy Information Administration. ↩︎
- U.S. Energy Information Administration. Henry Hub Natural Gas Spot Price. Accessed: August 21, 2025. ↩︎
- Sheridan, J. (2025). New York votes to end gas hookup subsidies, shifting costs to homeowners. ABC News 10. ↩︎
- Drewes, E. (2025). Your gas bill will be going down in July. Here’s why. Las Vegas Review-Journal. ↩︎
- Southwest Gas. Nevada Gas Cost Rates. Accessed: August 20, 2025. ↩︎
- Kresowik, M., Subramanian, S., Specian, M., Bradley-Wright, F., Ghosh, D., Mooney, P., Fraser, A., Sosa-Kalter, S., Fadie, B., and Mauer, J. (2025). The 2025 State Energy Efficiency Scorecard. Washington, DC: ACEEE. ↩︎
- Ibid. ↩︎
- We calculated average bills by dividing residential sales by the number of residential accounts. U.S. Energy Information Administration. Electricity Data Browser. Accessed: August 20, 2025. ↩︎