Despite its central role in preparing for disasters and coordinating the federal response, the Trump Administration announced an intention to dismantle the Federal Emergency Management Agency—thrusting states into uncertainty as they enter the summer hurricane and wildfire season. The sudden withdrawal of heretofore reliable (though often insufficient) federal support leaves states—and in particular their most vulnerable and historically underinvested communities—in a position of elevated risk.
Our analysis of historic disaster impacts illustrates the extreme variability in how a state may face limited climate impacts one year and billions of dollars in damage the next—and how the scale of this impact compares to individual state expenditures and their ability to respond.
States can take a number of steps to increase their resilience and disaster response capacity in the near and long-term, but the role of the federal government as a buffer against the unpredictability and volatility of climate disasters will be difficult to replace.
The misplaced and overwhelming financial burden of placing disaster response on states
Even if there were a transition plan to shift disaster response to the states, the federal government plays a foundational role in disaster management that states would have trouble covering. No one knows when and where the next hurricane or wildfire will hit, nor how destructive it will be, making planning and budgeting at the local level particularly challenging when response costs may be wildly variable from year to year. At the federal level, the total impact is smoothed out, causing less variation from year to year and making it easier to budget and plan.
We analyzed the ratio of maximum annual to average costs from NOAA’s billion-dollar disaster data set from 1980-2024, inclusive of 50 states and Puerto Rico. While these cost impacts are only for the largest disasters—impact data for smaller disasters is difficult to identify—the magnitude of this impact provides a clear illustration of the huge variability that individual states face. The highest ratio of any state or territory was for Puerto Rico, at a factor of 40.7. The lowest was Oklahoma, at 4.0. The US average was 6.1.
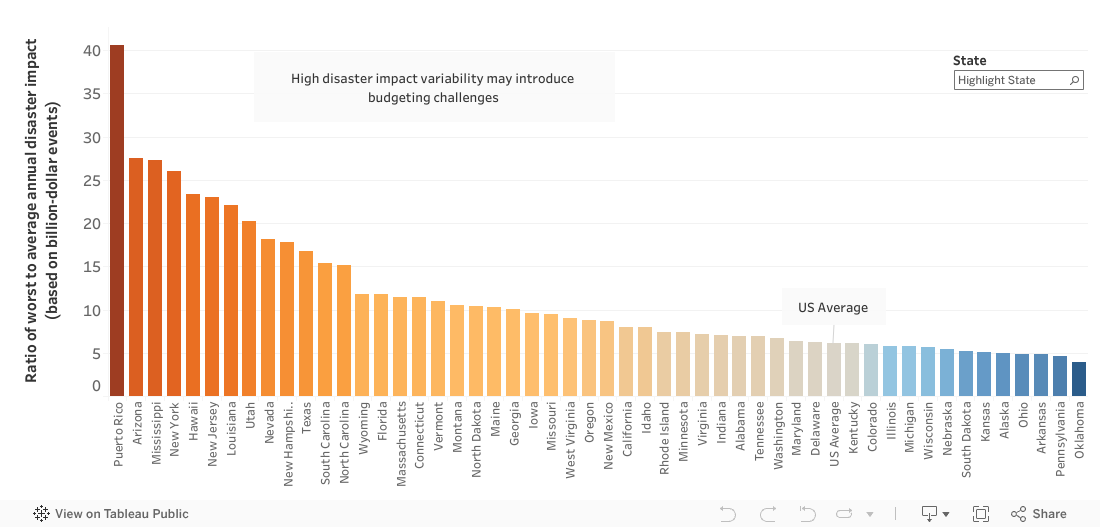
Ratio of Maximum to Average Billion-Dollar Disaster Impacts, by State (including Puerto Rico1), 1980-2024. 37 of 50 states and Puerto Rico had higher annual variability in disaster impacts than the national average, increasing the challenge of budgeting for disasters. Data source: NOAA.2
To get a sense of the scale of disasters and state ability to respond and assist with recovery, we next took a look at the magnitude of the worst annual climate and weather disasters compared to each state’s total annual expenditures.3 In the graph below, we plot the highest impact for billion-dollar climate and weather disasters from 1980-2024, and compare it to fiscal year 2024 estimated expenditures. We include general funds, bonds, and other state funds, but exclude federal funds, to reflect the scale of budgets that states can potentially reallocate to respond to disasters without federal support.
The graph below shows that six states and Puerto Rico—including large states like Texas and Florida—have faced disaster impacts that exceed their most recent total annual state expenditures (excluding federal funding). However, these incredibly high damage levels should not obscure the fact that even much smaller budget impacts can be hard for states to accommodate. We calculate that nearly two-thirds of states and Puerto Rico have had years in which annual billion-dollar disaster impacts (CPI-adjusted) exceeded 10% of their state expenditures (for the most recent year available, 2024)—and again, these numbers do not include impacts like business disruption, do not include smaller disasters, and are expected to continue to increase in the coming years.
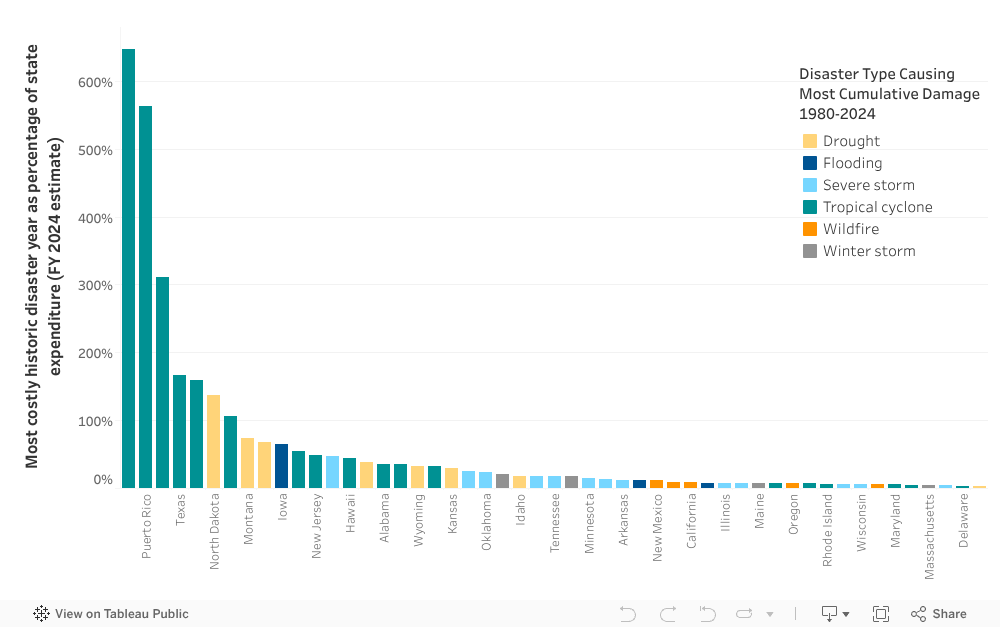
Most costly historic disaster year compared to state expenditures. The largest annual impact from billion-dollar disasters4 (CPI-adjusted) as a fraction of estimated state expenditures5 (fiscal year 2024, general funds, other funds, and bonds excluding federal funds) illustrates the potential scale of disaster impacts compared to state budgets without federal support. Tropical cyclones (hurricanes) in particular threaten to overwhelm budgets.
1 The NOAA database did not have any recorded billion-dollar disasters for other territories, which is likely due to their small size and the billion-dollar threshold for the database, not the relative impact of disasters on these territories.
2 NOAA National Centers for Environmental Information (NCEI). (2025). U.S. Billion-Dollar Weather and Climate Disasters (2025). DOI: 10.25921/stkw-7w73. Accessed: May 25, 2025.
3 National Association of State Budget Offices. (2024). 2024 State Expenditure Report: Fiscal Years
2022–2024.
4 NOAA National Centers for Environmental Information (NCEI). (2025). U.S. Billion-Dollar Weather and Climate Disasters (2025). DOI: 10.25921/stkw-7w73. Accessed: May 25, 2025.
5 National Association of State Budget Offices. (2024). 2024 State Expenditure Report: Fiscal Years 2022–2024. Table 1.